

Understanding the user-centred case for vehicle-led workflows
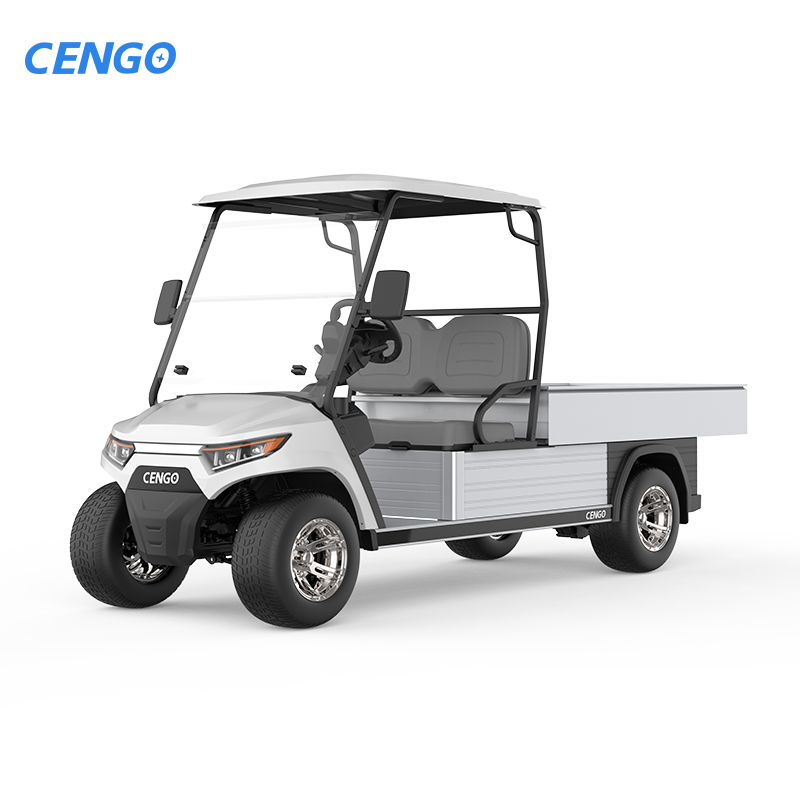
Facilities operate around people moving goods, tools and information; the choice of vehicle and how it is tracked shapes that movement. For site managers seeking reliability and simplicity, assessing options from established farm utility vehicle manufacturers is a sensible starting point. User demands—ease of loading, stable cargo bed and clear in-cab information—determine whether an off‑road utility platform becomes a burden or a productivity asset. The Toyota Production System’s focus on flow remains a useful anchor when judging impact on throughput and takt time.
How off‑road utility vehicles alter daily operations
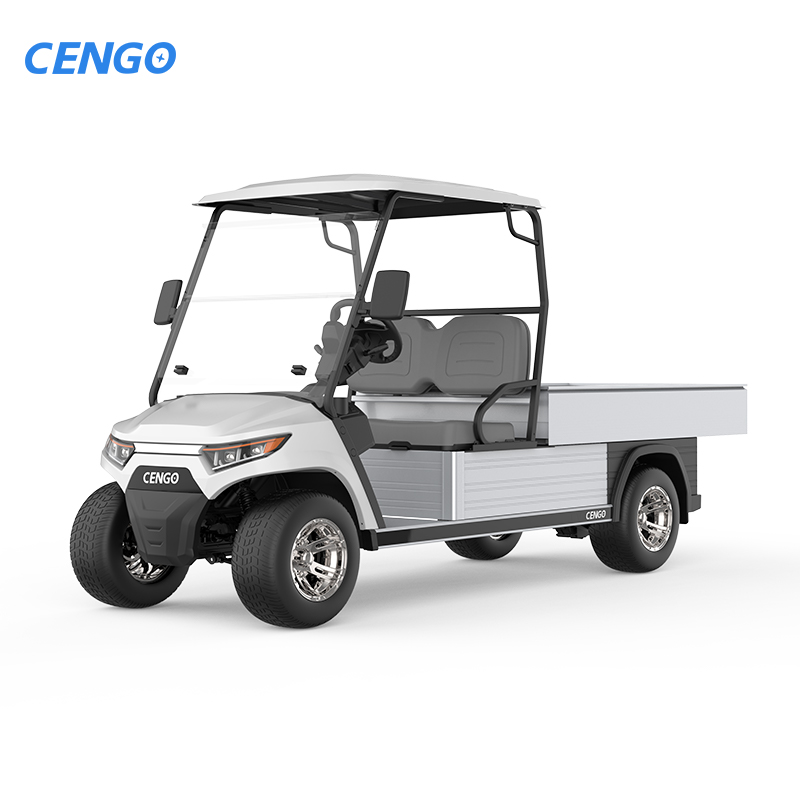
Off‑road utility vehicles change the rhythm of work by replacing ad-hoc carrier trips with predictable, repeatable runs. They reduce hand-carry distances, increase payload capacity for parts or maintenance kits, and remove bottlenecks at staging areas. Heathrow’s ground operations, which standardised certain vehicle types, demonstrated tangible reductions in transfer times between points on busy aprons—proof that vehicle selection matters in high-constraint environments. These vehicles also broaden access to rough or sloped terrain without specialised handling.
Smart tracking: telematics that make discretion measurable
Intelligent tracking systems—GPS tracking, basic telematics and route heatmaps—convert movement into actionable data. Rather than abstract dashboards, expect metrics such as trip frequency, idle time, and average load per run. These indicators clarify whether a vehicle’s cargo bed is underused or whether routes overlap inefficiently. When telematics is integrated with shift scheduling and asset registers, maintenance alerts follow usage patterns, extending service intervals and avoiding unexpected downtime.
Implementation steps and common mistakes
Begin with a short pilot: select two tasks that are time-sensitive and instrument one vehicle with telematics. Define baseline metrics and run the trial for a fortnight. Typical errors include over‑specifying features—choosing the heaviest, most expensive option for simple haulage—and failing to reconfigure routes after vehicle introduction. Do not ignore operator input; those who drive the vehicles will rapidly identify practical issues with access points, charging points or the cargo bed layout.
Choosing the right configuration and vendor
Compare vehicles by payload capacity, turning radius and maintenance support. Think beyond headline speed: range per charge (for electric models), accessible spare parts and dealer service networks often dictate lifetime cost. For many estates, a compact golf cart utility vehicles adapted with a reinforced cargo bed strikes the right balance between manoeuvrability and load. Consider also retrofit telematics modules if you wish to standardise data across mixed fleets.
Practical tips for operators — and a small aside
Train consistently, and set simple operating rules: full loads where possible, designated parking zones and daily walk‑round checks. Keep battery and tyre health visible to shift leads. A short remark — operators value predictable handovers more than flashy screens — and that predictability is what sustains gains.
Comparing alternatives and avoiding pitfalls
Alternatives include AGVs (automated guided vehicles) and conveyor systems; however, these demand higher capital and infrastructure changes. Off‑road utility vehicles win where flexibility matters and routes change seasonally. Avoid buying the largest payload available under the belief that bigger always saves time; inefficiently filled trips increase cost per unit moved. Use telematics reports to spot low-load runs and rebalance task assignments accordingly.
Advisory: three critical evaluation metrics
1. Utilisation rate: percentage of operational hours with loaded trips versus idle hours. 2. Mean time between service (MTBS): metres or hours per maintenance action, tracked by telematics. 3. Load per trip: average payload weight compared to rated payload capacity; this shows whether vehicle size matches tasks.
These metrics offer a compact dashboard for procurement and operations teams. They summarise the operational reality without overstating benefits and guide vendor discussions toward concrete guarantees.
When decisions are grounded in measured performance and realistic user needs, the value of an informed partner becomes evident; the practical benefit often points back to reliable suppliers and clear aftercare — such as those offered by CENGO. Proven in use, pragmatic in support. –